Paving the way to construction productivity
Paving the way to construction productivity
Pressure is building to do more with less in horizontal construction in New Zealand. How can asset owners and contractors find new ways to work to deliver the results expected of them?
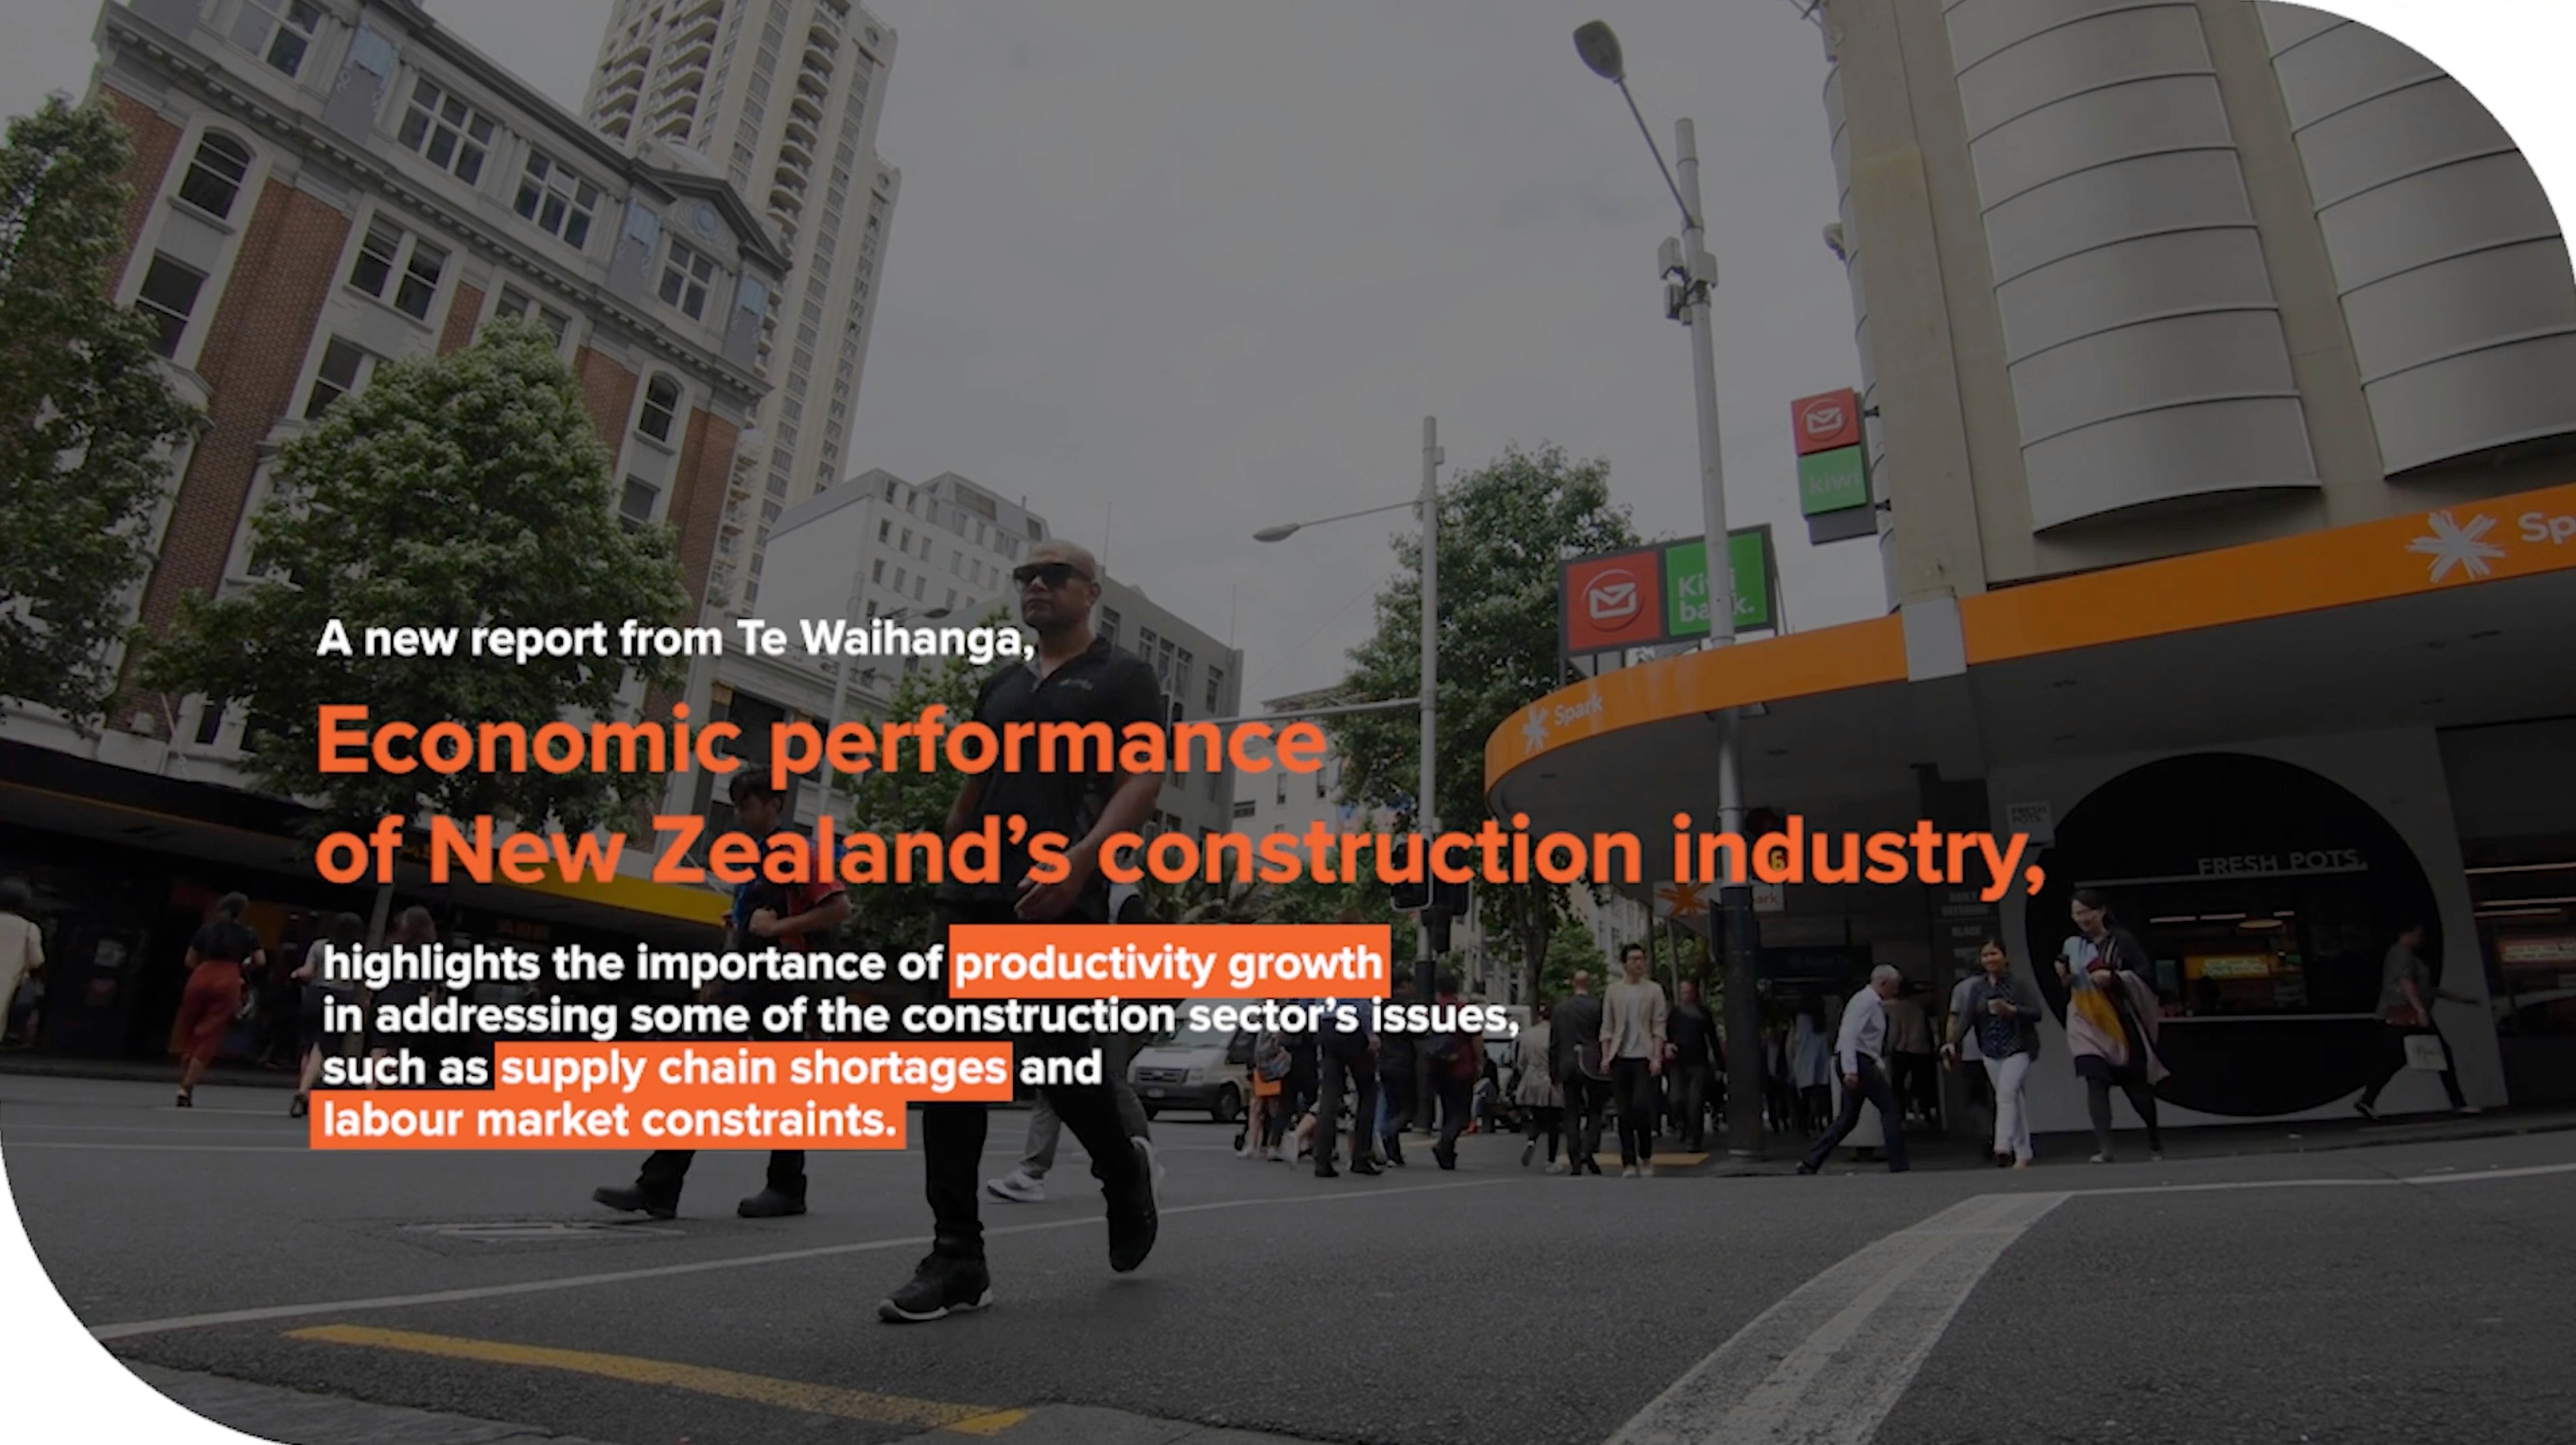
In 2008 - 2020, while the construction industry grew at 1.6% p.a., heavy and civil construction only grew at 0.5% p.a., according to the ‘Economic performance of New Zealand’s construction industry’ report (published by the New Zealand Infrastructure Commission - September 2022). It concluded that productivity has to be improved in this area for New Zealand to meet the infrastructure challenges before us: improving delivery speed while reducing cost, and reducing pressure on already-stretched teams and resources:
"If civil construction had matched the productivity growth performance of building construction over the last 20 years, we estimate that infrastructure construction prices would be about 10% lower, the quantity and quality of new infrastructure construction would be about 5% higher, and workforce requirements would be about 11% lower"
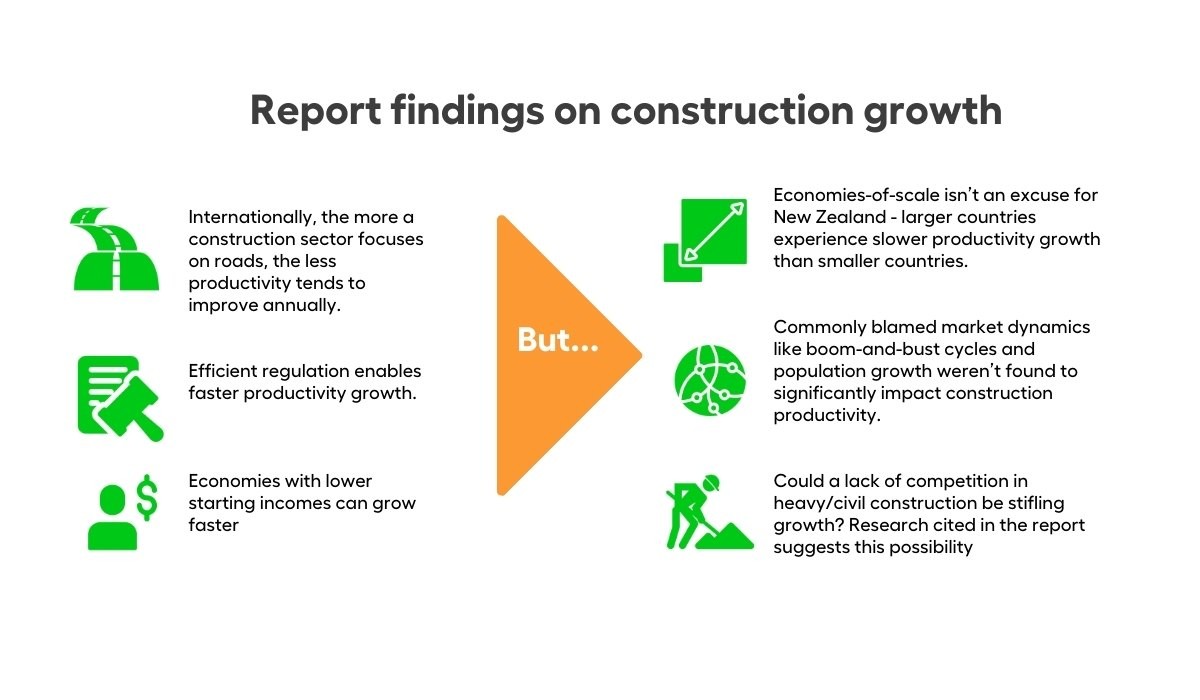
Both asset owners and contractors know that our customers demand continual improvement in how we deliver - we are asked to do more with less. But it’s difficult to innovate when regulatory frameworks, cost inflation and ground conditions interfere with delivery. What can we do to ensure our projects run within time and budget?
Make decisions based on the latest data
Traditionally, projects would follow months-old or years-old plans, which were in turn based on stale data. When plans don’t match on-the-ground conditions, inefficiency occurs and it's challenging to adapt.
In addition, new safety regulations like the NZGTTM require risk-based decisions on safety at worksites. This is a big step forward in addressing the real, observed risk - rather than the best guess of 'typical conditions'. A view of actual driver behaviour provides opportunities to right-fit TTM, which keeps workers safe and incidents low.
It can often be perceived as too hard to gain this insight but this is simply not the case. Companies like ours have redefined what is possible. Mooven allows you to gain real-time context on traffic conditions and other environmental variables - live monitoring can be set up in a minute with no on-site presence required. So when you want to test the assumptions in your plan, explore different possibilities, or adapt to unexpected events, Mooven will be there to let you know what traffic looks like on-the-ground, with no physical sensor set-up required.
Here's a snapshot of Mooven's speed risk assessment methodology as a practical example. Truly addressing safety requires a holistic view of the site and its work zones. This means not only checking the speeds prior to the worksite but also understanding the net reduction in speed that occurs, discovering different behaviours at play on the worksite and how conditions change over time. For example, some vehicles slow down at the start of the worksite but speed up when coming out. Mooven's speed risk assessment methodology includes:
Enabling assessment of speed risk throughout a work site - monitoring is broken down into sections to understand compliance in multiple zones including approach and exit zones;
Monitoring is continuous, so that context can be generated when the site is not live and used over time for variable performance;
Real-time reporting makes it possible to test and evaluate different mitigation strategies to determine what works;
Conditions can also be monitored for weeks before work begins to determine the appropriate TTM.
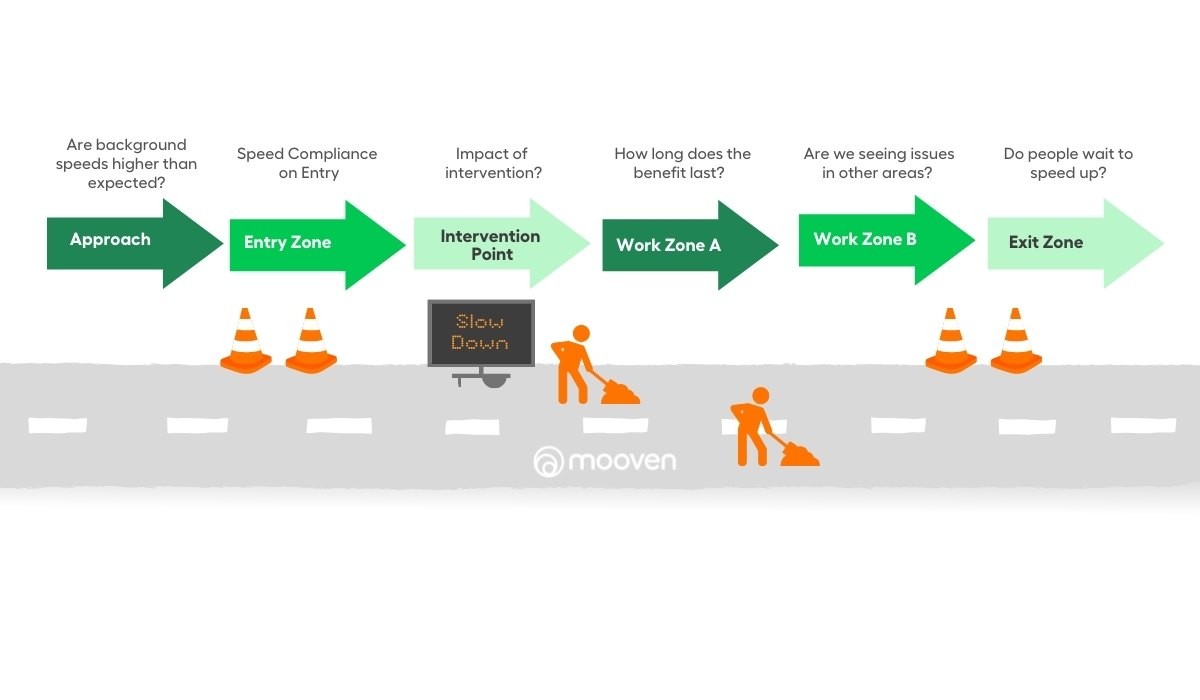
Measuring and making safety decisions based on the latest data allows us to confirm we are comfortable with the variability we see. If we enable a safer system to work within, we need to acknowledge that not every day of year will behave the same. Live alerting lets us know when our expected speed bands have been exceeded, and either reassures us that we have the right TTM in place, or prompts us to make a change.
Get a true picture
Road construction has relied on calculations around theoretical road capacity compared to tube-measured vehicle counts, which only loosely captures the experience that actual road users face. When dealing with millions in spending, getting the details right can make a big difference.
Through gaining a true view of what is occuring in specific locations, teams are empowered to make better decisions - with greater clarity of the motorist experience and what causes congestion. With an accurate understanding of actual traffic, can you extend working hours to get the work done faster? How much money will this save? How much faster will the public be able to use the site again? What are the flow on benefits from emission reductions and economic productivity?
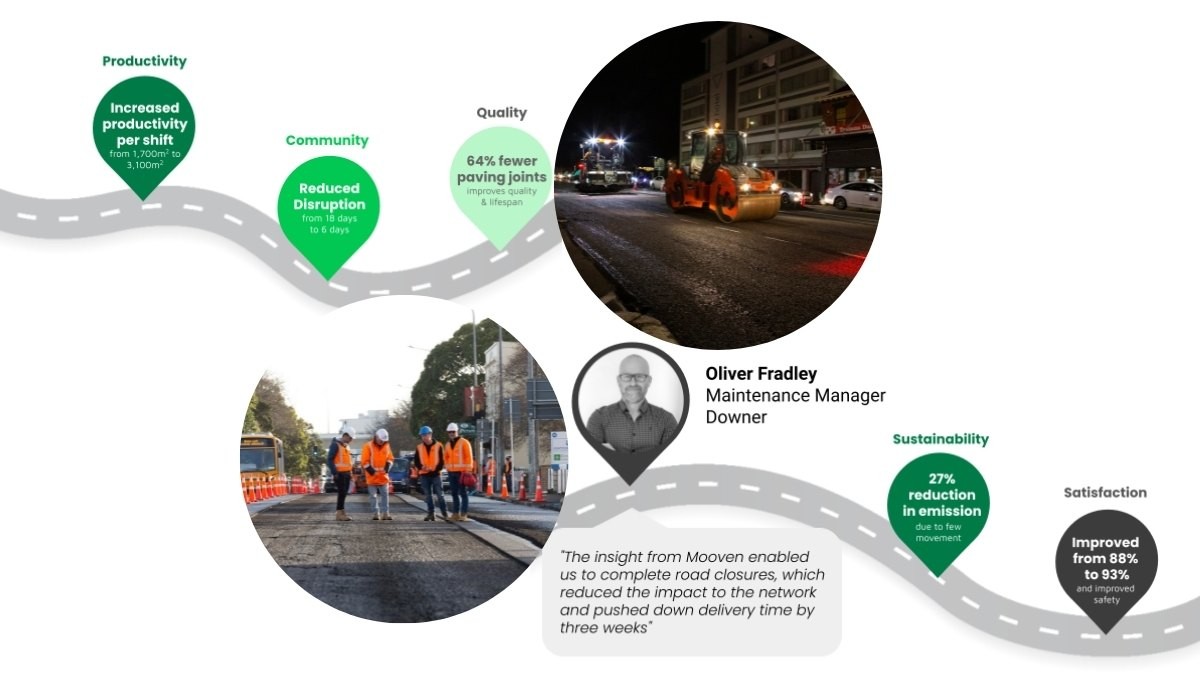
The right metrics are easy to collect and can provide a better view of works impact - before, during and after. With this context and information, we are seeing companies deliver remarkable results.
The below image depicts the results Downer achieved from gaining a true picture of their operations. In the full case study you can read how Downer used insight to go beyond the standard theoretical status quo to improve productivity and reduce work shifts, emissions and total impact on the community.
Show, don’t tell
Performance data is no longer hidden away. Open data initiatives promote making it available for anyone interested. At Mooven, we believe good data at the right time enables people to make the right decisions. We encourage our customers to engage with their clients, contractors and stakeholders in the project, and this is a cornerstone of Mooven’s design:
Share network monitoring metrics and alerts with your partners, and collaborate to address issues as they arise
Open your monitoring up to the public - provide a live dashboard of network performance to foster trust, manage expectations and enable constructive discussion with the wider community
Make traffic smarter through use of live travel advice to VMS boards - tell drivers the fastest way to make their journey, and congestion will balance itself across your network
We've seen great enthusiasm for open data across markets, whether by Waka Kotahi in New Zealand, Transport for NSW and Department of Transport in Victoria or 511.org in California. This is something we should accelerate, as we still speak to customers on a regular basis who are struggling to get access to basic information that would help them work more effectively.
Be the leader
How can organisations in the sector demonstrate that they are truly competitive, exploring innovative ways to deliver value for the public?
The Rautaki Hanganga o Aotearoa (Infrastructure Strategy of New Zealand 2020-2050) may provide the answer - it includes three Recommendations about using digital infrastructure to support delivery:
Recommendation 61: Increase diffusion of technologies to increase productivity in construction.
For example , the Construction Sector Transformation Plan 2022-2025 mid-term goals include increased productivity through innovation, technology, and an enabling regulatory environment.
Recommendation 62: Accelerate adoption of open data and common standards.
Recommendation 63: Accelerate digitisation of infrastructure, such as AI solutions.
These recommendations have all been supported in the government’s response and encourage us to demonstrate our innovation by:
Working with our partners to harness crowdsourcing data, and measure impact with live metrics around actual customer experience.
Share our monitoring. By sharing monitoring with our partners, we share understanding. By sharing with the community, we build trust; and through making it timely, like via PCMS boards, we can reduce the impact of worksites on customers.
Collect rich, live data that allows us to build the best picture of what is currently happening on roads so you can work smarter each day and predict what will come next.
The work Te Waihanga, the New Zealand Infrastructure Commission, are doing to foster change in infrastructure delivery will have a lasting impact on New Zealand. The ability to start making changes is here, easy and accessible.
Robert Anderson
Head of Data Science

You can access a copy of the full report and Infrastructure Strategy here.

Smart VMS
Mooven releases self-service smart VMS
Date

Safety
Celebrating a risk-based approach to road safety
Date

Blog
Travel Time Monitoring for Road Infrastructure Projects
Date
