Product Release: Journey time and interactive reporting
Unlocking New Insights
We are excited to introduce two options that will help you to unlock new insights.
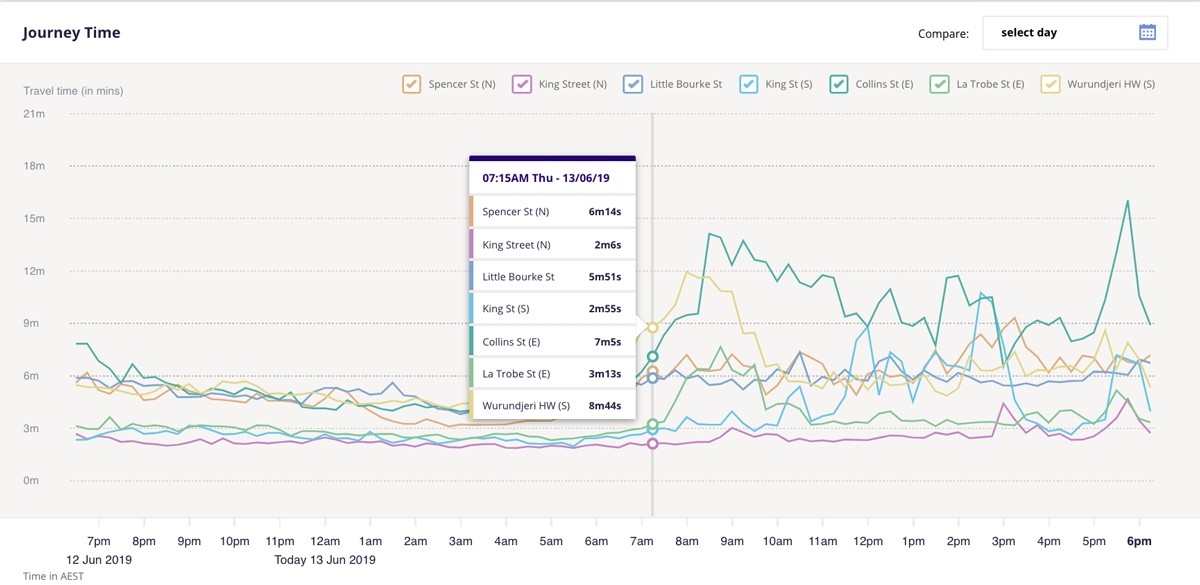
Journey Time Graph - Within the Mooven product, you now have the option of adding a Journey Time graph. This shows the total time taken to travel a route.
Interactive Reporting - In addition, automated reporting can be pushed to a popular Microsoft tool, PowerBI, to provide tailored reporting around particular projects with daily updates.
Our interactive reporting has been in beta testing for the last few months and has proven to be a quick and easy way of delivering tailored reports for specific projects.
Journey Time Graph

By popular request, we have included a journey time graph that shows the time taken to travel a route.
This is useful for understanding journey time reliability, how delays relate to total travel time and customer experience levels. It can also be used to improve visibility of round trip journey times for construction vehicles.
Interactive Reporting:
When custom reporting is required, we can now push data into Microsofts's PowerBI to provide a rich and interactive experience.
Reports are automatically updated mid-morning so you can view results from the morning peak. Wanting to build a custom visualisation, not a problem, there are lots of different options available.

Smart VMS
Mooven releases self-service smart VMS
Date

Safety
Celebrating a risk-based approach to road safety
Date

Blog
Travel Time Monitoring for Road Infrastructure Projects
Date
